A few months ago, I was asking a potential customer about how his IT resolves their performance issues.
I started the discussion with few questions. Then I asked him, “What do you look for when your end user complains about application performance issues?”
He said , “ We check all of the resources to see if all lights are green or red.”
I asked him, “ What do you do if lights are red?”
“We allocate more resources to our servers to see if the performance gets better.”
“Why do you think server resources are causing the problem?”
He replied with a laugh, “Today we have tools that report red or green. But we don’t have tools in IT that tell us where the hell the delay is!”
Then he asked me ,”Why, do you have something that tells us what the user is experiencing? Or is your product yet another monitoring tool?”
My response was “No, we are not ‘Yet another monitoring tool’. With our tool you can see what the user is experiencing.”
“Well, I need a tool that tells me where the actual slowness is coming from and can show me what the end user is complaining about”.
End users using applications delivered through Citrix or delivered directly sometimes complain that their applications are slow. Today, IT operations should look for tools that tell how the End User Experience is getting affected when their applications are running slowly. IT operations needs an out-of-box solution that reports the End User Experience. AppEnsure measures End User experience.
Our AppEnsure end user centric solution has benefits for Citrix IT operations because AppEnsure measures the response times of every application that relies on the backend application infrastructure. AppEnsure is a true Application Performance Measurement tool. Many monitoring tools out there don’t have this visibility. End User Experience is determined by measuring packet response time, and we measure it by flow analysis, not synthetic transactions.
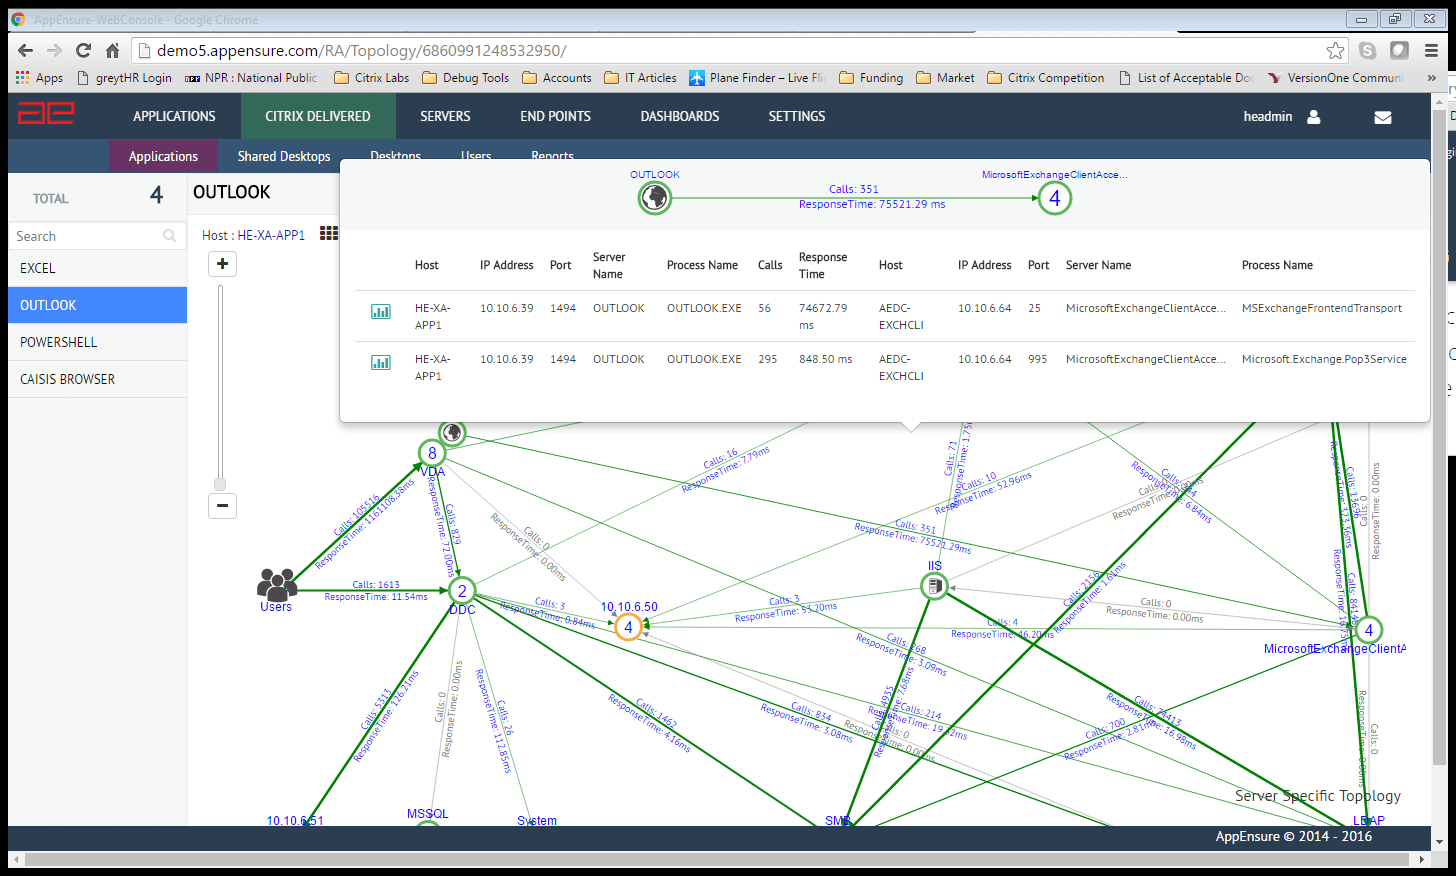
The AppEnsure Topology view graphically shows the current response times from the application throughout all of the backend infrastructure. You can visually pick out just where the delay begins and immediately know which server or device is causing the delay.
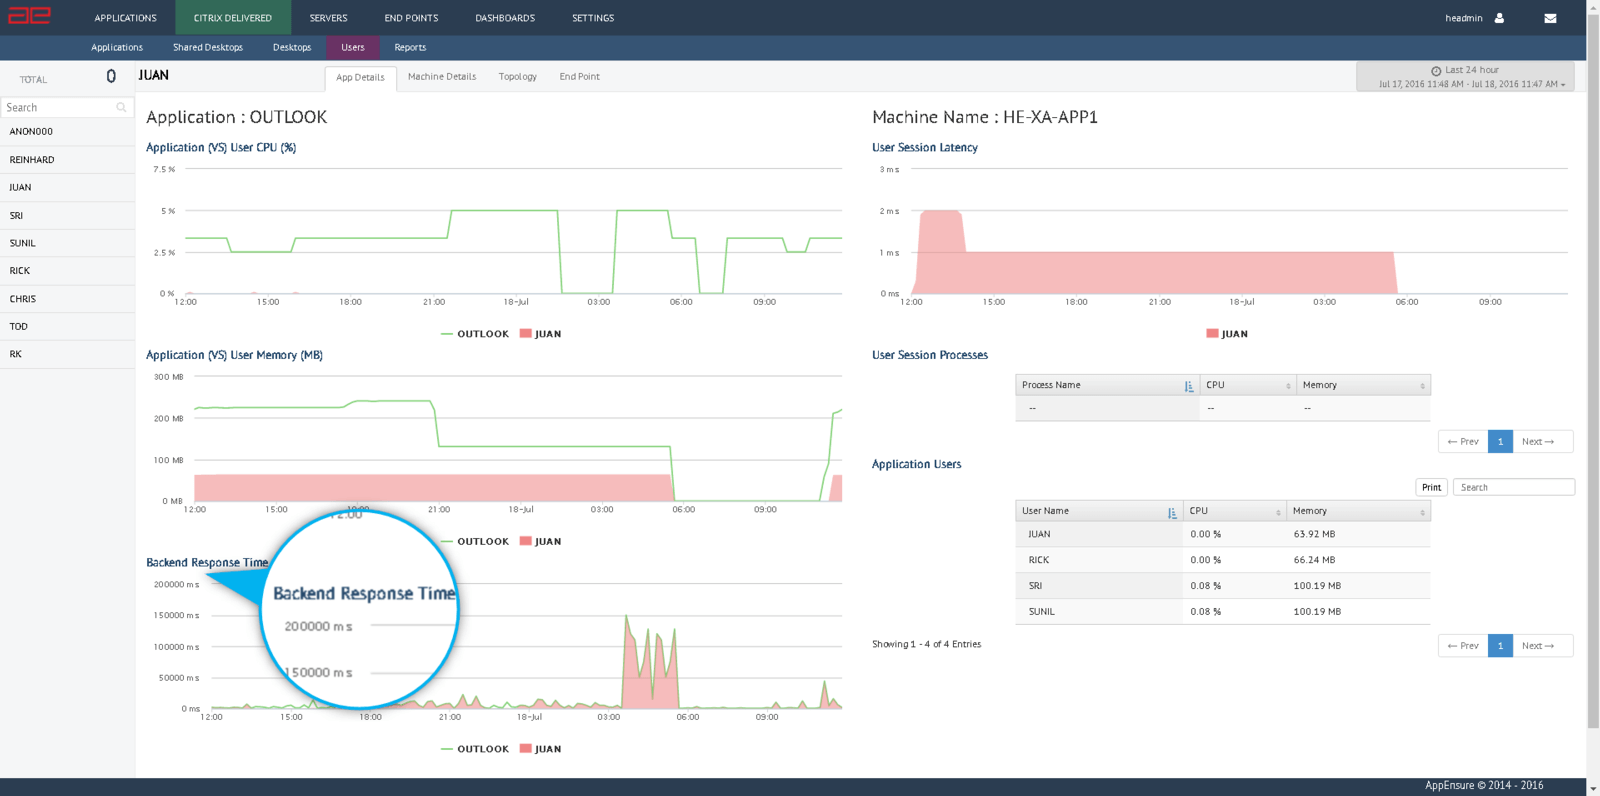
There is also a User Centric with Application view that shows the backend response times in correlation with resources used by the application.
As I was describing this to him he said,” This is measuring the user experience by pointing to backend response time and latency. Today when our end users complain, we don’t have visibility like this, so we are just relying on provisioning additional resources and then somehow looking to see if the problem the user sees is getting better”.
AppEnsure monitors the response times of every user in every application across multiple silos, and gives visibility into real End User Experience. With AppEnsure you immediately know exactly where the hell the delay is.