 IT has access to an amazing amount of data. Often we collect hundreds of data points on one server such as individual processor load, thread state, disk throughput both in and out etc. We then store this in a bin and use this to create a metric called something similar to server performance. When it comes time to provide reports (weekly, monthly and so on) IT then assign some poor person the job of collating this information. This is usually done by running a report and importing it into a spread sheet and then combining various servers and metrics into some grouping and calling it an application. Then some numbers are calculated and saved in the spreadsheet to create a performance over time graph. The same is done with database numbers, application performance, network statistics etc. This process is then repeated by levels of management combining more numbers into a single number to represent a service performance to allow reporting to more senior levels of management.
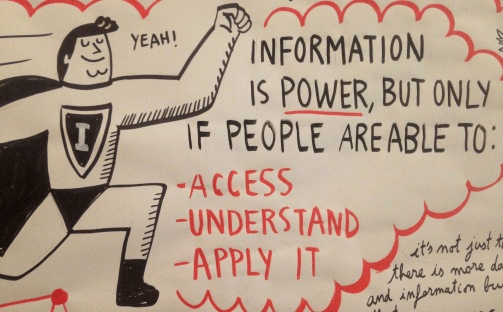
Data Management and IT – Operational Intelligence
 Given that IT is all about automating processes this has struck me as somewhat backwards. IT by and large is staffed by realists – the type that don’t respond well to marketing, want solutions and have little time for repetition. A second reality is that IT is a fledgling science. While it has a century under its’ belt it has not developed some niceties like the common taxonomy of biology; every company creates its own rankings and groupings of IT functions. Quite often a great deal of resources are used in creating the custom taxonomy. To add to the frustration of IT managers everywhere different off the shelf applications also present data in the taxonomy that is coded specific to that application. It becomes more and more difficult to extract and combine data in a meaningful way.
An IT user friendly application should allow its user base to create rules for the grouping of data for reports. By allowing atomic bits of data such as unused server capacity for a select group of servers it now can report on the unused server capacity for an application. Using this application data as a new data point the well-designed application will allow another ad hoc grouping to provide information on an over-all service. This process of using groups to create other groups goes on as needed until the application is configured to match the taxonomy the company has designed. Instead of complex calculations each month a one-time setup is created and automation is achieved. By allowing different data elements to be members of more than one group we can avoid a second common pitfall such as the question of factoring the time of DNS queries or a multi-application database server.
IT needs to save time and its internal applications need to accept the reality reporting against an ever changing data set that is custom to each company that uses it.
AppEnsure and its grouping solution is great example of allowing customization that allows in depth and summary information to be used in near real time and in management reporting that is meaningful to different levels and verticals in an organization.