Category Archives: Uncategorized

Availability is NOT equal to Responsiveness

July 28, 2016 | By: Robin Lyon, Director of Analytics

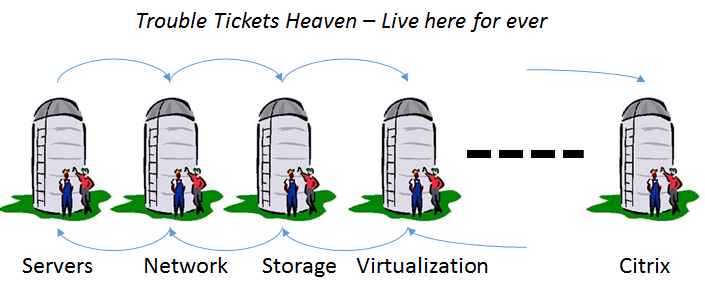
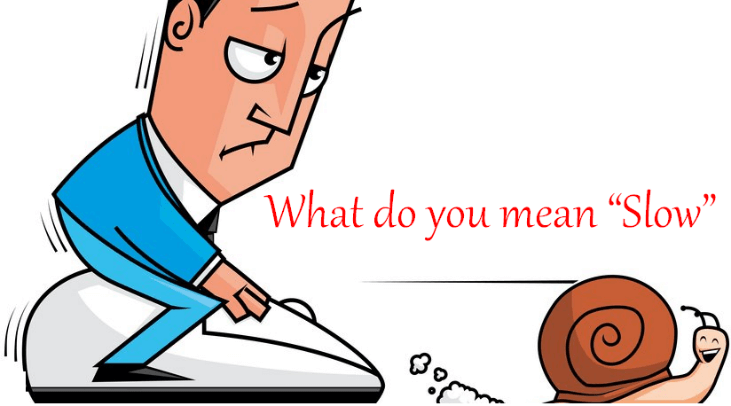
How many of us IT professionals have been in a meeting similar to this:  The chairs of various departments throughout the company are sitting around a long table and are giving a monthly summary.  IT presents that the applications, network and servers were some amount of 9’s available and may explain an outage.  The meeting goes on and then one of the heads explains a failure to meet department goals by stating some application was ‘slow’.  IT is asked about it but unfortunately can only present data upon number of tickets and general up time.  The slow comment is then picked up another department and IT is left in the untenable position of defending its metrics and supposedly achieved goals while other departments are blaming IT for lack of productivity. 


The real problem is one of communication of expectations.  IT has data that supports availability but the customer is complaining of slowness.  Slowness is a subjective term and for IT to resolve the difficulty different metrics and SLAs are needed.  Fortunately, there is a perfectly good way to measure slowness – time.  When we think of availability we need to understand we are actually speaking of capacity while the users are interested in throughput.  By measuring transaction time (the amount of time it takes for the user to commit an action and receive the corresponding data from the program they are using) IT can state how fast an application is working in objective terms.  SLAs can be established that some percentage of the transactions during a reporting period will be completed within a certain amount of time.  This allows business decisions based upon performance and is a salve for the mysterious ‘slow’ comment.


Availability is one of the early metrics IT has used to create a simple number to represent complex systems.


Using an Application Performance Management tool like AppEnsure allows better business decisions by the use of an a well know metric – time.


More of the same…

July 26, 2016 | By: RK, Principal Architect

A few months ago, I was asking a potential customer about how his IT resolves their performance issues.

I started the discussion  with few questions. Then I asked him, “What do you look for when your  end user complains about application performance issues?”

He  said , “ We check all of the resources to see if all lights are green or red.”

I asked him, “ What do you do if lights are red?”

“We allocate more resources to our servers to see if the performance gets better.”

“Why do you think server resources are causing the problem?”

He replied with a laugh, “Today we have tools that report red or green. But we don’t have tools in IT that tell us where the hell the delay is!”

Then he asked me ,”Why, do you have something that tells us what the user is experiencing? Or is your product yet another monitoring tool?”

My response was “No, we are not ‘Yet another monitoring tool’. With our tool you can see what the user is experiencing.”

“Well, I need a tool that tells me where the actual slowness is coming from and can show me what the end user is complaining about”.

End users using applications delivered through Citrix or delivered directly sometimes complain that their applications are slow. Today, IT operations should look for tools that tell how the End User Experience is getting affected when their applications are running slowly.  IT operations needs an out-of-box solution that reports the End User Experience. AppEnsure measures End User experience.

Our AppEnsure end user centric solution has benefits for Citrix IT operations because AppEnsure measures the response times of every application that relies on the backend application infrastructure. AppEnsure is a true Application Performance Measurement tool. Many monitoring tools out there don’t have this visibility. End User Experience is determined by measuring packet response time, and we measure it by flow analysis, not synthetic transactions.

The AppEnsure Topology view graphically shows the current response times from the application throughout all of the backend infrastructure. You can visually pick out just where the delay begins and immediately know which server or device is causing the delay.


There is also a User Centric with Application view that shows the backend response times in correlation with resources used by the application.


As I was describing this to him he said,” This is measuring the user experience by pointing to backend response time and latency. Today when our end users complain, we don’t have visibility like this, so we are just relying on provisioning additional resources and then somehow looking to see if the problem the user sees is getting better”.

AppEnsure monitors the response times of every user in every application across multiple silos, and gives visibility into real End User Experience. With AppEnsure you immediately know exactly where the hell the delay is.

Making Sense of Data – Operational Intelligence

July 22, 2016 | By: Robin Lyon, Director of Analytics


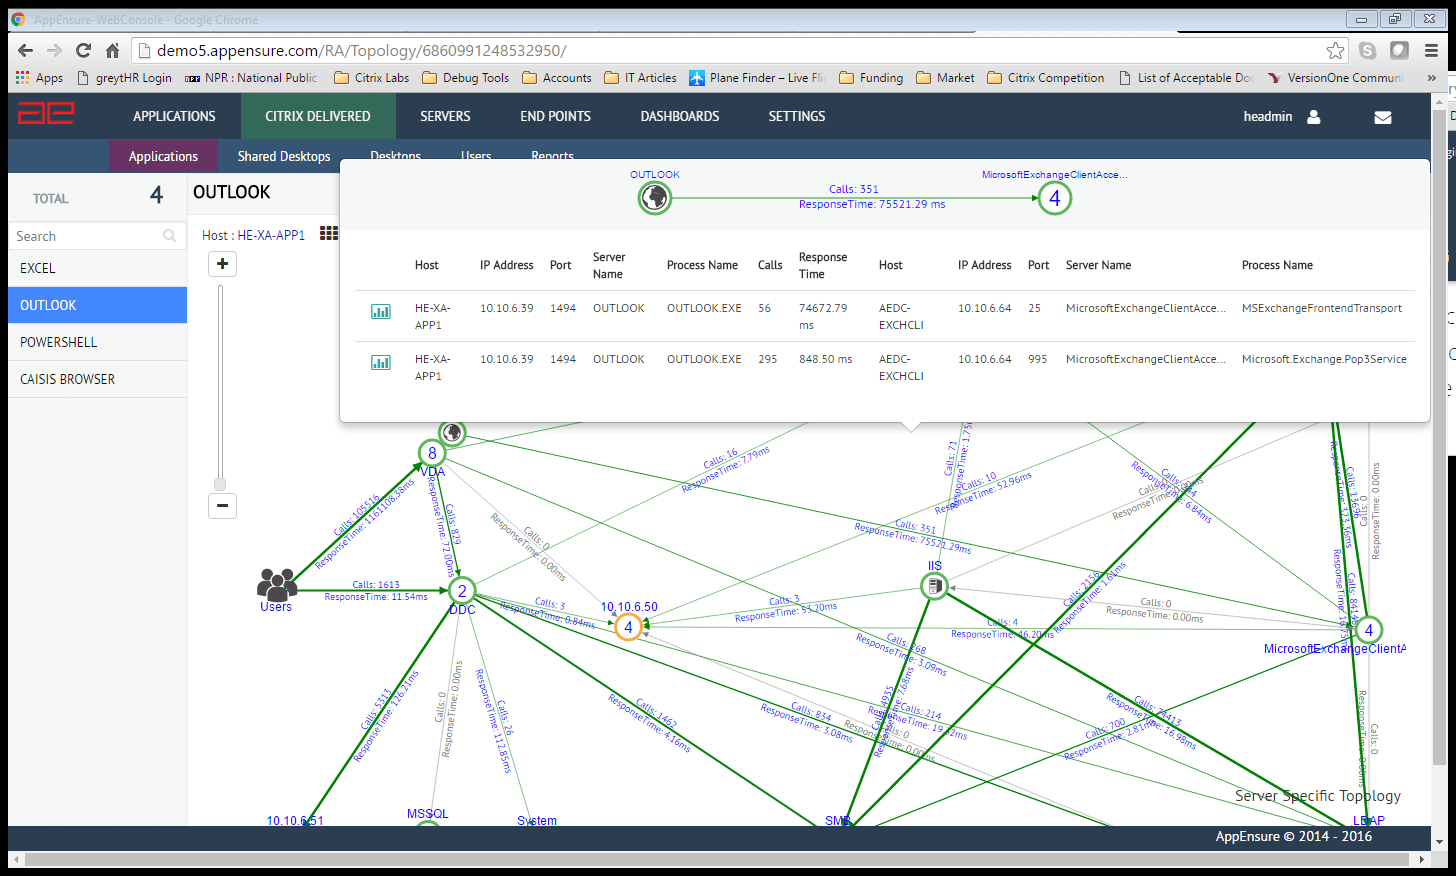
IT has access to an amazing amount of data.  Often we collect hundreds of data points on one server such as individual processor load, thread state, disk throughput both in and out etc.  We then store this in a bin and use this to create a metric called something similar to server performance.  When it comes time to provide reports (weekly, monthly and so on) IT then assign some poor person the job of collating this information.  This is usually done by running a report and importing it into a spread sheet and then combining various servers and metrics into some grouping and calling it an application.  Then some numbers are calculated and saved in the spreadsheet to create a performance over time graph.  The same is done with database numbers, application performance, network statistics etc.  This process is then repeated by levels of management combining more numbers into a single number to represent a service performance to allow reporting to more senior levels of management.


Data Management and IT – Operational Intelligence


Given that IT is all about automating processes this has struck me as somewhat backwards.  IT by and large is staffed by realists – the type that don’t respond well to marketing, want solutions and have little time for repetition.  A second reality is that IT is a fledgling science.  While it has a century under its’ belt it has not developed some niceties like the common taxonomy of biology; every company creates its own rankings and groupings of IT functions. Quite often a great deal of resources are used in creating the custom taxonomy.   To add to the frustration of IT managers everywhere different off the shelf applications also present data in the taxonomy that is coded specific to that application.  It becomes more and more difficult to extract and combine data in a meaningful way.


An IT user friendly application should allow its user base to create rules for the grouping of data for reports.  By allowing atomic bits of data such as unused server capacity for a select group of servers it now can report on the unused server capacity for an application.  Using this application data as a new data point the well-designed application will allow another ad hoc grouping to provide information on an over-all service.  This process of using groups to create other groups goes on as needed until the application is configured to match the taxonomy the company has designed.  Instead of complex calculations each month a one-time setup is created and automation is achieved.  By allowing different data elements to be members of more than one group we can avoid a second common pitfall such as the question of factoring the time of DNS queries or a multi-application database server.


IT needs to save time and its internal applications need to accept the reality reporting against an ever changing data set that is custom to each company that uses it.


AppEnsure and its grouping solution is great example of allowing customization that allows in depth and summary information to be used in near real time and in management reporting that is meaningful to different levels and verticals in an organization.


Application Performance: Tired of Finger Pointing

July 18, 2016 | By: Reinhard Travnicek, Managing Director, X-Tech

After more than 20 years of experience with Citrix application delivery I and most of my customers are getting tired to take the blame for sluggish application performance and finger pointing that goes every time there is an issue with application performance.

Today success of Citrix deployments is crucial to many of my customers, because they are designing their entire IT delivery around Citrix technology. Nothing shines a light on an IT team’s success or failure as much as the application performance and availability does. With high uptimes as IT’s priority in the past, they need to adapt a more holistic approach to performance management and decision analytics today. New tools entering the market can help companies leverage IT investments made. There is a need to discover, interpret and respond to the myriad events that impact IT operations, security, compliance and competitiveness. Frankly speaking IT cannot depend on the help desk to be its eyes and ears for keeping systems running at their best, they need to have bulletproof data to prove their SLA obligations.


Monitoring solution designed with End-User transactional performance in mind, will provide IT Ops with application performance and virtual desktop performance correlated with user productivity. Armed with this data, IT Ops can rapidly investigate users’ complaints of poor app performance, determine other impacted users and the likely root causes resolving the issue before workforce productivity is impacted. For that reason, organizations will increasingly be using application performance metrics such as application and transaction response times and end-user experience indexes that allow them to monitor the speed of applications and to evaluate the quality of the end-user experience. Plenty of CPU resources, network bandwidth to spare, affordable storage space and Big Data analyses will help to build passive monitoring systems and solutions which are able to deal with the huge amount of data gathered by the monitoring sensors installed.


We at X-Tech believe that AppEnsure offers a monitoring solution as described above.  As technology was promising when introduced to us couple of years ago, we partnered and worked closely with AppEnsure to fine tune the solution as end-user centric for Citrix deployments.


Are you Benefiting your End Users?

July 13, 2016 | By: Brad Denniston, Senior Solutions Architect

When you are working in IT Operations, your customer is the person who sends a request. Think back to being in front of a bank cashier or at a checkout counter when you insert you card. What do you expect? You expect:


·         the correct response (I took your money)

·         within the expected time, usually a couple of seconds.


Those are the two main benefits your data center provides. If you don’t provide those benefits your business loses customers. It will filter down to you through sales, then marketing, then the CIO then – what are you going to do now?


If your data center is carefully monitoring all the hardware (servers, drives, routers, etc.) and all of the software (each OS, each process, each FIFO, etc.) you cannot detect if your customer is getting a response in the time they expect. You will see availability of the resources but not the quality of service or end-user experience.


You have to look at what the customer sees.


You have to watch each request from your customer and measure the response time of the reply to that packet to see what your customer sees.  That is the second benefit you provide to your customer. This works only if you measure the response time of EVERY customer request and raise an intelligent, actionable alert when the response time deviates from what has been working just fine. AppEnsure does this.


With AppEnsure you can:


·         immediately inform affected customers that you know about the delay

·         immediately start working around and/or fixing the delay where it is occurring.


How do you immediately get the information you need to fix the problem? Go back to where I said, “an intelligent, actionable alert”.


AppEnsure operates with an agent on every application server. When an unusual delay is detected the agent immediately runs down the path of the requesting packet and checks all the devices on the path. It’s looking for anything unexpected like broken links, delayed connections, full buffers, or overloaded disk drives. All the agents watch all device error messages from disk drives, DNS, firewalls etc. These agents send all of this data to the Master where the data is all intelligently cross correlated to come up with a report that says:


·         most likely cause of the problem

·         where the problem is

·         suggested fixes


Now within a few seconds you know what is needed to work around the problem to keep your customers happy and you know what to investigate for a long term solution.


With AppEnsure you are providing satisfactory benefits to your customers and resolving issues before they get to your management.


Are You Proud and Confident?

March 31, 2016 | By: John Ward, Head of Sales

Over two decades ago, I began my sales career in the monitoring software industry. An infrastructure monitoring vendor I was with for over ten years, had the tag line, “Be the first to know.” After all this time, I now realize we were borrowing that phrase from the future. Now is the future, though the tag line should be, “Don’t be the second to know.” The truth is IT Operations and Helpdesk staff should know at the same time that a user or group of users are experiencing a slow application response. In fact, they should not need to hear from a user before taking action to improve service levels for all users of the problematic application performance. With real-time monitoring of every call from every user, for all critical applications in an organization, the degradation of service levels will be immediately identified and the root cause pinpointed, so user productivity can remain optimized to service the business’s bottom line.


To this day, IT professionals still tell me they want to be the first to know. That they are NOT the first, and, many times, they are left scrambling for answers with no real visibility into the culprit comes across as being embarrassing to them. So, wouldn’t it be great if you could confidently and proactively commit to service levels that would exceed your users’ expectations? Well, when you utilize a tool that provides real-time application performance monitoring from your users’ real-data perspective, you can over deliver and be proud to be a profit center for your organization.

Trouble Ticket Heaven

February 23, 2016 | By: Sri Chaganty, CTO


In our series Facts from the Field, #5 explains how AppEnsure helped a big customer close down what the Dir of IT Ops, Steve, calls “Trouble Ticket Heaven”, the place where the trouble tickets can live forever!!! He is NOT being complimentary in this definition.


The start point for this is that many legacy applications that were “modernized” by applying a web layer at the access layer, are streamed using XenApp as the delivery mechanism. This an effective approach and widely used, however, the independent tech silo admins have never found an effective way to see where the issues are that cause slowness, hence passing trouble tickets around, not closing them.


Steve’s BU users were typically having 30 – 60 seconds delays for published applications to respond back.  They would call the Citrix admins complaining and the Citrix admins looked at all the counters they get from Citrix which claimed that everything is working well.  Then they pass the trouble ticket to the backend infrastructure team who would look at the application servers and determine that everything is fine because the servers that are running the application workload all report back with green lights that they are up and running.  However, this approach to tech silo “availability” cannot highlight slowness problems as this approach does not give the granular visibility of every call coming from XenApp and what its’ response time is.  The ticket remains open in Trouble Ticket Heaven and the user gives up and gets used to the slowness.


With AppEnsure deployed, we quickly identified the bottleneck was in the backend infrastructure.  We were able to drill down immediately showing that the calls coming from XenApp were the ones that were experiencing long response times compared to other calls that were directly accessing the backend infrastructure.  We were able to automatically detect that there was a proxy misconfiguration which resulted in multiple retries from the XenApp executable to get the response back from the infrastructure. The trouble ticket was issued directly from the Citrix admins to the server team with the specific IP addresses and misconfiguration identified. Problem successfully identified and resolved in real time!


That is how AppEnsure closes “Trouble Ticket Heaven” completely, resolves problems quickly and makes Steve look like the local Superhero. Congratulations Steve!


I Didn’t Do It!

February 15, 2016 | By: John Ward, Head, Sales

For those of us with siblings, we know what it is like to be blamed for something we didn’t do. In the school classrooms of our youth, you also may remember getting blamed collectively for the trouble for a few of our fellow classmates were the cause of. We also may remember allowing our siblings and/or classmates take the blame and the subsequent interrogation even when we knew it wasn’t their fault. We were just happy to be in the clear.

Fast forward to our adult lives, and we still find our objective can be to defend and deflect when there is trouble heading our way. For IT professionals, this can come in the form of who is to blame for performance issues. Discovering the location and the peers that can take responsibility AND who can fix it, expeditiously, should be the paramount goal. One technology group that often is blamed for a poor user experience is the Citrix delivery team.

IT Operations professionals need a comprehensive monitoring solution that can determine whether or not the Citrix delivery infrastructure is the culprit or is it the backend infrastructure of the applications being delivered or published.

When a tool like this doesn’t exist in your IT tool bag, there is no quick way to determine the root cause of the end-user’s poor application experience. Why spend countless hours and IT resources playing the blame game, when there is such a tool available that will make users more productive, the company more money and IT work more gratifying?

Great When Your Customer Says it Best

February 10, 2016 | By: Colin Macnab, CEO

I was recently copied on an email from an executive of IT Operations at a top 10 US financial corporation. It was sent to his team to explain why he wanted them to start deploying AppEnsure. I liked it so much that I thought I would put it right on our blog:

“Hi all, I want to introduce you to AppEnsure, an end user performance solution that tells us how the application is experiencing the infrastructure, as measured by the end user experience of application response times. It is designed for HA (High Availability) at enterprise scale and is complimentary to the data we get from APM.

1. Live architecture analysis: the only thing that I can guarantee about the CMDB is that it is WRONG minutes after it is defined! We can’t use static tools in dynamic, virtualized cloud deployments.

2. You can see the Gartner definition of AA-IPM: “Application Aware Infrastructure Monitoring” at https://www.gartner.com/doc/2678316/leverage-applicationaware-infrastructure-performance-monitoring. That is what Appensure is and does.

3. We have APM tools to perfect the code but they aren’t designed to show application interactions with infrastructure. They do not account well, if at all, for topological performance data across silos and different infrastructure elements/technologies. APM gives us the App internals and tuning elements but NOT the infrastructure elements.

4. So both capabilities are needed for a complete understanding of end to end response time, APM for code performance & Appensure is the other part of the delivery experience overall. It has very elastic Splunk like qualities and powerful built in correlation capabilities. These attributes get us to TTD & TTR much faster than digging around manually. It also provides trending. Unlike legacy tools such as IP Mon or SiteScope etc. which are device based tools, this one is top down. Once it builds service maps, in minutes, you’re in business. No nitpicking and endless hand builds. Powerful & quick!”


Thanks for that, I could not have said it better myself. I know your team will like the results they will get with AppEnsure. It is great that you have the previous experience and insight to know.

Facts from the Field #4: “IT Operations with Texas-Sized Grins”

November 3, 2015 | By: Sri Chaganty, Founder and CTO

With almost 25,000 LinkedIn impressions of our Facts from the Field series so far, I am excited to keep the momentum going and to share one of my favorite facts from this past October.

At AppEnsure, it’s customary to fill out a Trip Report upon return from all business travel. The report summarizes the purpose, findings and recommendations to document business meetings and, in essence, justify the trip’s expense. Travelling from California to Georgia along with two engineers, I was off to meet with our newest customer, the VP of IT Architecture at a company that employs over 50,000 people. The purpose was to expand their deployment by 200%. Upon arrival, the VP met us in the lobby with two of his engineers and said, “I really hope I didn’t make the three of you come all the way here for nothing,” he shared after some friendly handshakes. I visualized a blank trip report in my head.

“The port isn’t open. I asked. I double-checked. But the port we need it isn’t open right now.” Days ago in preparation for today’s meeting, we discussed the technical needs to expand the deployment. He then quickly added, “But, the good news is that it’s lunch time and the port should be open by the time we finish eating. Then let’s dive into finding the answer to my latest problem. One that I haven’t even shared with y’all.”

Over our lunch, the team and I learned a lot about this VP’s twelve years at his company…and more about why they purchased AppEnsure. “The reason I bought your product was because it improved our visibility into XenDesktop performance,” he stated. “Now I have another application challenge and I think AppEnsure can help.” Their custom-built application – a revenue-generating, truly business-critical, heads-will-roll-if-this-goes-down application – was not performing as expected and the finger pointing game was in full effect for the last 36 hours. The application was a “modernized” legacy application that I’ll code name “Goliath” because it was massive (and, maybe, a reminder that even small things can bring a giant application down.)

“The latest release of Goliath went into production two days ago and I feel like the Applications group basically said ‘We built and tested the best application possible. The ball’s in your court, IT Ops, so make it perform with your infrastructure,’” he expressed with frustration. “But the problem as I see it is that 30% of application development is backlogged…multiple app dev projects are being outsourced to multiple vendors all happening simultaneously…and this ultimately results in constant change to the application architectures that Ops is just unaware of.” Adding to his frustration he talked about the App teams bringing in code instrumentation, but still not solving the problem and continuing to point the finger at the infrastructure. “It perfects the code but not the code’s interaction with the infrastructure. That’s why we are going to see what AppEnsure shows us today,” he said much more optimistically.

With a lunch long over and the deployment expanded to approximately 200 servers and 8000 desktops, it was now time to point fingers at AppEnsure to find the problem. With agents strategically deployed on the servers and desktops that serve and deliver Goliath, the application was automatically detected along with all of its dependents and critical information such as response time and throughput. But it wasn’t until we looked at the Topology Map for Goliath to produce three Texas-sized grins on these Georgians. “This is the view,” he said. “Because it’s real-time, it’s the only true view of how the application is working with the infrastructure. We can see changes that are taking place with workloads.” And with that statement, the three Texas-size grins were now coming from the visiting Californians.

AppEnsure and our combined team of six had discovered transactions to a backend SQL server directly from a presentation tier component in the workload. According to their “approved” architecture, the components of the presentation tier MUST NOT communicate directly with the SQL server. It seemed odd and we were skeptical of our finding but it was clear: a discovery by inter enquiry across three outsourced developers revealed that someone as part of an application enhancement had broken the SQL rule. “This is exactly the type of example I was describing at lunch,” he said. “Operations was totally unaware of the fact….until now. I need to make a quick phone call.”

Back in the lobby, and leaving for the airport surprisingly ahead of time, we started saying our goodbyes. Having shared many jokes about my team needing enough information to fill our trip report throughout the afternoon, I loved the VP’s last words to us. “We’re going to expand our deployment yet again with you next month. You can put that in your report.”
===========================================
Related Facts from the Field
Facts from the Field #1: “It’s Where you Measure”
Facts from the Field #2: “I Love It when People Pick on Citrix.”
“The Wild Card – The Citrix End User”