 There has been much discussion about the new parameters that Insight/Director provide with ICA Round Trip Time (RTT). The general perception is that ICA RTT provides the end-to-end response time for applications or desktops delivered. This is NOT correct.
Many times the application or VDI published will access the backend infrastructure that supports the application or VDI. The back-end infrastructure response time is not part of the ICA RTT.
The ICA RTT is a single metric and does not give the hop-by-hop breakdown of the various latencies.
DC Latency is misleading as it includes idle or inactive TCP sessions. Ideally ICA RTT should be greater than the sum of WAN Latency and DC latency. If the application is not actively sending data, then it does not work as expected. This is because the TCP RTT estimation works only on active connections. If a connection is not very active or if it is idle, the DC latency value will be more than the ICA RTT or WAN Latency.
Independent of Insight/Director
AppEnsure provides the end-to-end response time without any dependencies on the Insight/Director or NetScaler. AppEnsure’s true end user response times can cross-verify the information that is presented by Director on the ICA RTT for local users.
AppEnsure integrates with Insight/NetScaler and retrieves data that adds intelligence to AppEnsure collected metrics. The details of integration are described below.
End-to-End & Hop-by-Hop Response Time breakdowns
As described earlier, AppEnsure presents the end-to-end response time from an end user’s perspective that identifies the service levels that are being provided to each user for each access of an application or a VDI. The service level of each access determines the end user’s experience with an application or VDI for every access, which in turn determines the productivity of the work force. Besides providing the service level for each user, the overall service level of all users is provided to define the overall performance of the delivery of these applications or VDI to the set of users that are accessing the application or VDI. This comparative metrics enables the users to identify the overall performance of an application or VDI and quickly identify a single user or a set of users that might be experiencing degraded performance.
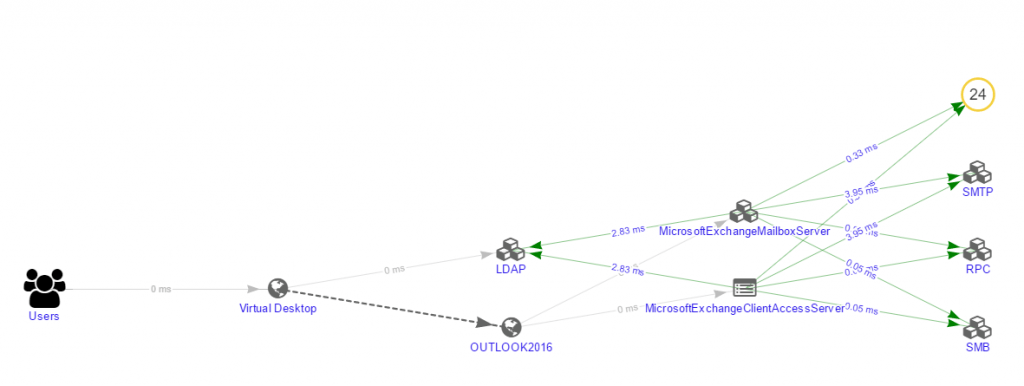
AppEnsure breaks down the overall end-to-end response times into hop-by-hop response times for each user as well as for all the users, at a given time. This enables the users to identify which hop in the entire service delivery chain of the application or VDI is negatively contributing to the overall end-to-end response time.
The topology map from AppEnsure below, which is automatically discovered by AppEnsure, shows how the end-to-end response times are broken down into hop-by-hop response times for the same example set up described above.

End-to-End & Hop-by-Hop Throughput Breakdown
AppEnsure also provides additional metrics regarding the throughput in terms of calls. A “call” is the entire transaction from a user to an application or VDI starting from the initial handshake when the user initiates a dialog with the application or VDI by a click, to the point the click is responded back to from the server side, which might include back-end response access as well. When a call is initiated, the server side might respond back either with results for the request or with an error in the case there is a problem with the request. AppEnsure identifies both successful and unsuccessful calls (errors) and presents them individually. This enables identification of which users are experiencing degraded performance due to increased number of errors generated, either from the server side or from the client side. If a particular user is generating many error calls that the server determines are client errors, AppEnsure identifies such users individually. In this approach, end user behavior patterns, while accessing an application or VDI, are reflected in the metrics presented by AppEnsure.
Generally, throughput is provided by most solutions in terms of bytes in and bytes out. This representation does not identify which user is making more calls and which user is making less calls. Besides, byte representation will not provide information if a single user with a lesser number of calls is dominating the server’s attention, due to the nature of the request made which leads to starvation of resources for other users, who might experience degraded performance.
Call volumes calculated by AppEnsure embed the intelligence to understand the behavior patterns of an application or VDI usage based on the hour of the day, day of the week, week of the month and month of the year.
Back-end Infrastructure Response Times
Many applications published through XA/XD and the VDIs delivered depend upon back-end infrastructure. In most cases, the applications run on back-end infrastructure and are accessed via an ISS server published on XA/XD. In other cases, thin clients like Outlook provide access to the back-end mail services.
Back-end infrastructure is sometimes within the data center and in other cases could be a Software as a Service (SaaS) that enterprises subscribe to. The back-end infrastructure even if hosted within the data center of an enterprise might not be accessible to the Citrix administrators as it is usually managed and maintained by a different group. In any case, today Citrix administrators have no way to understand the availability and the responsiveness of the back end infrastructure when their customers (end users) are accessing those applications. AppEnsure provides that visibility, which is not available from the Insight/Director.
Back-end infrastructure responsiveness dictates how the end user is experiencing an application. Back-end infrastructure responsiveness is dependent upon various factors that include:
- Load on the application
- Resources available
- Availability of infrastructure services that the back-end is dependent upon
- Time of the day when the access occurs
AppEnsure provides such visibility, which is not available to Citrix administrators or support groups today.
Operational Intelligence
AppEnsure retains unlimited data, unlike Insight/NetScaler, empowering users to harvest this data for operational intelligence of their environment to depict application performance and user behavior patterns.
AppEnsure comes with a self-learning baselining of response times for every session in Citrix deployments. The baselining provides an understanding of how service is being provided to the end users. This in turn establishes the normal conditions when users are not complaining, but also forewarns about abnormal conditions, which today you are dependent on the end users complaining in order to understand there is a performance problem.
Once normal operational performance is established, desired Service Levels can be defined. AppEnsure then monitors the performance against the desired service levels and generates an alert and alarms with root cause when such desired service levels are not met by any application or VDI, to any of the users.
Diagnostics
Unlike Insight/Director, AppEnsure does not limit itself to reporting the response times end-to-end and hop-by-hop. When a response time deviation occurs, AppEnsure performs diagnostics at multiple levels in the service delivery chain and provides the possible root cause for such degradation.
The root cause analysis enables Citrix administrators to quickly identify the location of the problem so that appropriate teams can be alerted to resolve the issue.
Integration with NetScaler/Insight and Director
AppEnsure integrates with Insight/NetScaler. It fetches the ICA RTT value from NetScaler/Insight along with other parameters listed below. These values are displayed per ICA session along with the comparative metrics that AppEnsure collects, correlates and displays. AppEnsure’s screens provide these values in a manner to show how all the sessions are responding in comparison to a single session. The data collected from NetScaler/Insight is also used in diagnostics.
If Insight Center is present, then AppEnsure can be configured to retrieve the following metrics from Insight Center which are displayed as well as used in diagnostics for determining root cause of a performance degradation:
- ICA Round Trip Time (Client & Server)
- WAN Latency
- DC Latency
- Client Side NS Latency
- Server Side NS Latency
- Host Delay
Conclusions
- AppEnsure offers significant advantages over Insight/Director in monitoring, managing and optimizing the end user experience in the Citrix environments.
- AppEnsure integrates well with Insight/Director and retrieves relevant data to correlate with its measurements to provide rich diagnostics.
- AppEnsure provides a new innovative approach in managing real end-user experience in Citrix XenApp(XA) and XenDekstop(XD) environments. AppEnsure uniquely correlates the real end-user response time experience with the application-delivery infrastructure performance, providing contextual, actionable intelligence which can reduce resolution time of application outages and slowdowns by over 95%.

