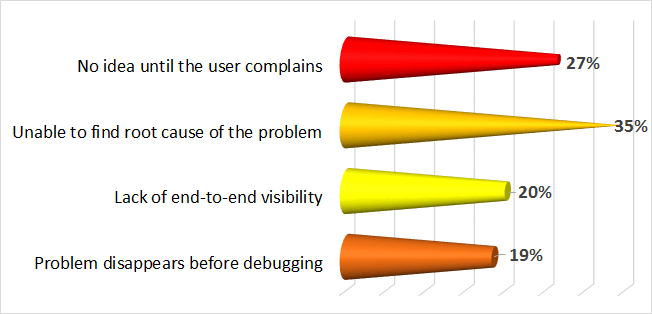
Citrix XenApp and XenDesktop have been around for many years, delivering IT Ops an essential ability to centrally manage and control costs of App and VDI delivery. The move to a new architecture in Xen 6.X accelerated deployments and now the move to the latest improvements in Xen 7.X is in full swing. We see this occurring globally, with generally good results. However, during these last two upgrade cycles, we have also seen the Digital Transformation of businesses, making delivery of an impressive End User Experience (EUX) now one of the most important objectives of the upgrade process. We also see most upgrades following the tried and trusted legacy approach of, first deployment rollout, then performance monitoring and management. Unfortunately this approach is self-conflicting, performance as an afterthought is a legacy approach that has not resolved performance issues well post deployment. If EUX is the primary or an important objective, then it needs to be part of the planning and deployment process at the start, to achieve the desired results.
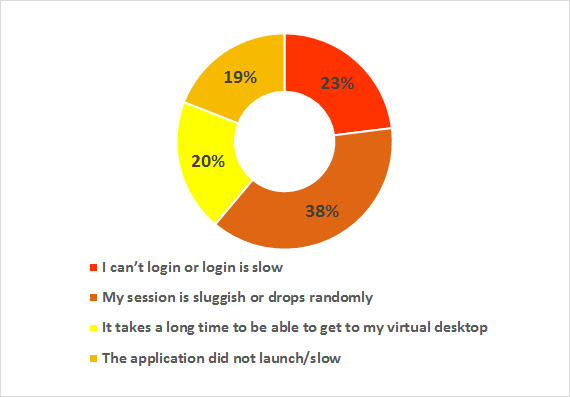
Oops, you did not approach your upgrade that way and now the users are complaining, the business is complaining and your management urgently wants IT to explain what all the time and money was spent on without resolving all the inefficient waiting that is the core complaint. Waiting to logon, waiting to access Apps, waiting for responses, waiting for the screen to refresh. Waiting! So, what to do to resolve this and deliver the performance that is now demanded by all. Often we see the application of legacy monitoring & management tools used in other parts of the stack to try to understand what the problems are. However, these tools were mostly architected before virtualization was part of the design remit. Recent revs to these tools cannot get past that initial architectural limitation, so they rarely resolve anything or present any new visibility into the issues. The waiting continues.
Citrix itself offers little to address these challenges, the recent End of Life of Edgesight was effectively their exit from addressing the subject. There are several 3rd party Citrix tools available that do address the subject, but they generally all are platforms for viewing the commodity data streams from Citrix and other sources in a single pane, not a source of real EUX measurements. While this can present some interesting observations, it does not rescind the old maxim, “commodity data gets you commodity results”. There are a couple of tools that actually do try to measure performance, but they use synthetic transactions, which is another way at guessing what the EUX might be, not an actual measurement of the real transactions and experience.
However, in the end all these tools fall under the influence of the mistaken belief that in a dynamic, distributed, virtualized IT stack, it is possible to collect enough metrics on the availability of various silos of technology; Citrix Servers, CPU, Storage, Networking, etc. and other feeds to infer what the EUX will be. You cannot, there will never be enough data to find the correct real result. Worse, as these deployments grow more and more complex with DevOps continuously evolving the Apps, it is getting exponentially more complex to even attempt this approach.
Further, the 3rd party tools available to monitor Citrix environments are confined to monitoring the Citrix silo only, a very incomplete and compartmentalized perspective. They provide large amount of data collected through API calls and PowerShell scripts from the underlying Citrix layers, but then require that subject matter experts review the logs after the fact and decipher the data to discover what is happening inside the Citrix silo. Therefore, these are not real time solutions. These solutions also fail to provide end-to-end visibility through the complete stack and the breakdown of that end to end visibility hop-by-hop. As a result, they assist establishing the fact that the end-user experience degradations are not the result of the Citrix silo, but fail to identify the actual root cause.
In some cases, these tools advise that an end user experience is degrading, but do not provide the reason behind it. Knowing your end user is having a bad experience is important for the Citrix administrator, but not knowing why they are having a bad experience is very frustrating. Since delivering optimal end-user experience involves many hops and layers, just knowing that there is a degraded delivery still requires that the Citrix administrators drill down even further into the various segments of the delivery, if they need to understand the root cause. This is the primary reason why end-user experience remains an unsolved mystery in Citrix environments.
At AppEnsure, we started with an entirely new approach, we measure the real response times of the actual transactions through the entire stack, end to end and hop by hop. We are measuring the actual time that an end user experiences for each transaction with the application at their screen, through the Citrix delivery tiers and into the backend Application tiers. We do also collect the metrics that others do, but we use that to confirm our root cause analysis results from our own deep measurements of real response times. We measure real milliseconds of EUX, not percentage availability of technical resources. This turns out to be the only way to do this and deliver real EUX results. Why doesn’t everybody do this, you might ask? Frankly, it is really hard and requires real technology, not just data collection capability. It has taken us years to develop, integrate and deliver this as an enterprise class product that provides real time answers using only 1-2% of resources while operating continuously.
This approach also provides multiple other benefits when engineered from the start:
- Auto discovery of all End Users and the Applications they are running
- Auto discovery and mapping of the complete stack and service topology without relying on (usually out of date) CMDBs
- Auto baselining of response times for every user and transaction at any given time and date to give intelligent contextual alerting of EUX excursions
- Auto correlation of events across the stack, without having to pull out logs and manually reviewing them
- Auto presentation of logon, App access, screen refresh times, etc. for all users and all transactions
- Auto root cause analytics with clear directions on where the problem is and who is being affected
None of this requires any configuration out of the box, though there is a complete console for those who want specific conditions for their environment. There are multiple report generation options, though with Rest APIs, JSON Inserts, SNMP Traps, Excel, email and text alerting, all the data can be imported into your own reporting environment. Further, as we never open the payload, there is not much to collect, each agent generates about 1 MB/hour of the metadata we create.
In summary, we have developed the fastest way IT Ops can proactively stop or find issues, reducing time to resolution by over 95% in most cases, with the lowest false positive and false negative results. That is the foundation to delivering an impressive end user experience. Please give us a brief 20-30 minutes on a call to demonstrate these capabilities to you live and confirm how you can lose wait that does not come back.

