 How many of us IT professionals have been in a meeting similar to this: The chairs of various departments throughout the company are sitting around a long table and are giving a monthly summary. IT presents that the applications, network and servers were some amount of 9’s available and may explain an outage. The meeting goes on and then one of the heads explains a failure to meet department goals by stating some application was ‘slow’. IT is asked about it but unfortunately can only present data upon number of tickets and general up time. The slow comment is then picked up another department and IT is left in the untenable position of defending its metrics and supposedly achieved goals while other departments are blaming IT for lack of productivity.
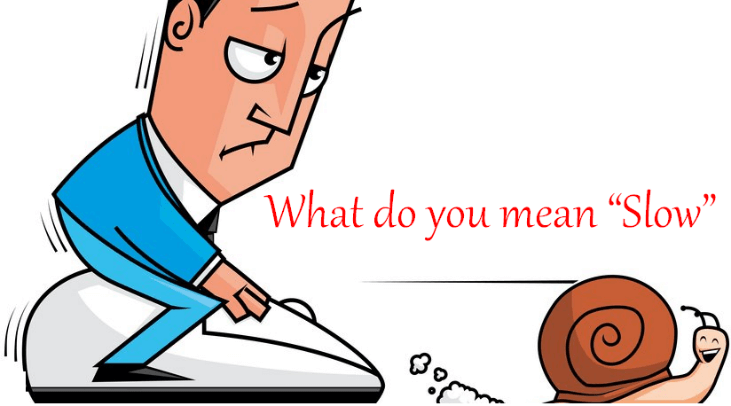
 The real problem is one of communication of expectations. IT has data that supports availability but the customer is complaining of slowness. Slowness is a subjective term and for IT to resolve the difficulty different metrics and SLAs are needed. Fortunately, there is a perfectly good way to measure slowness – time. When we think of availability we need to understand we are actually speaking of capacity while the users are interested in throughput. By measuring transaction time (the amount of time it takes for the user to commit an action and receive the corresponding data from the program they are using) IT can state how fast an application is working in objective terms. SLAs can be established that some percentage of the transactions during a reporting period will be completed within a certain amount of time. This allows business decisions based upon performance and is a salve for the mysterious ‘slow’ comment.
Availability is one of the early metrics IT has used to create a simple number to represent complex systems.
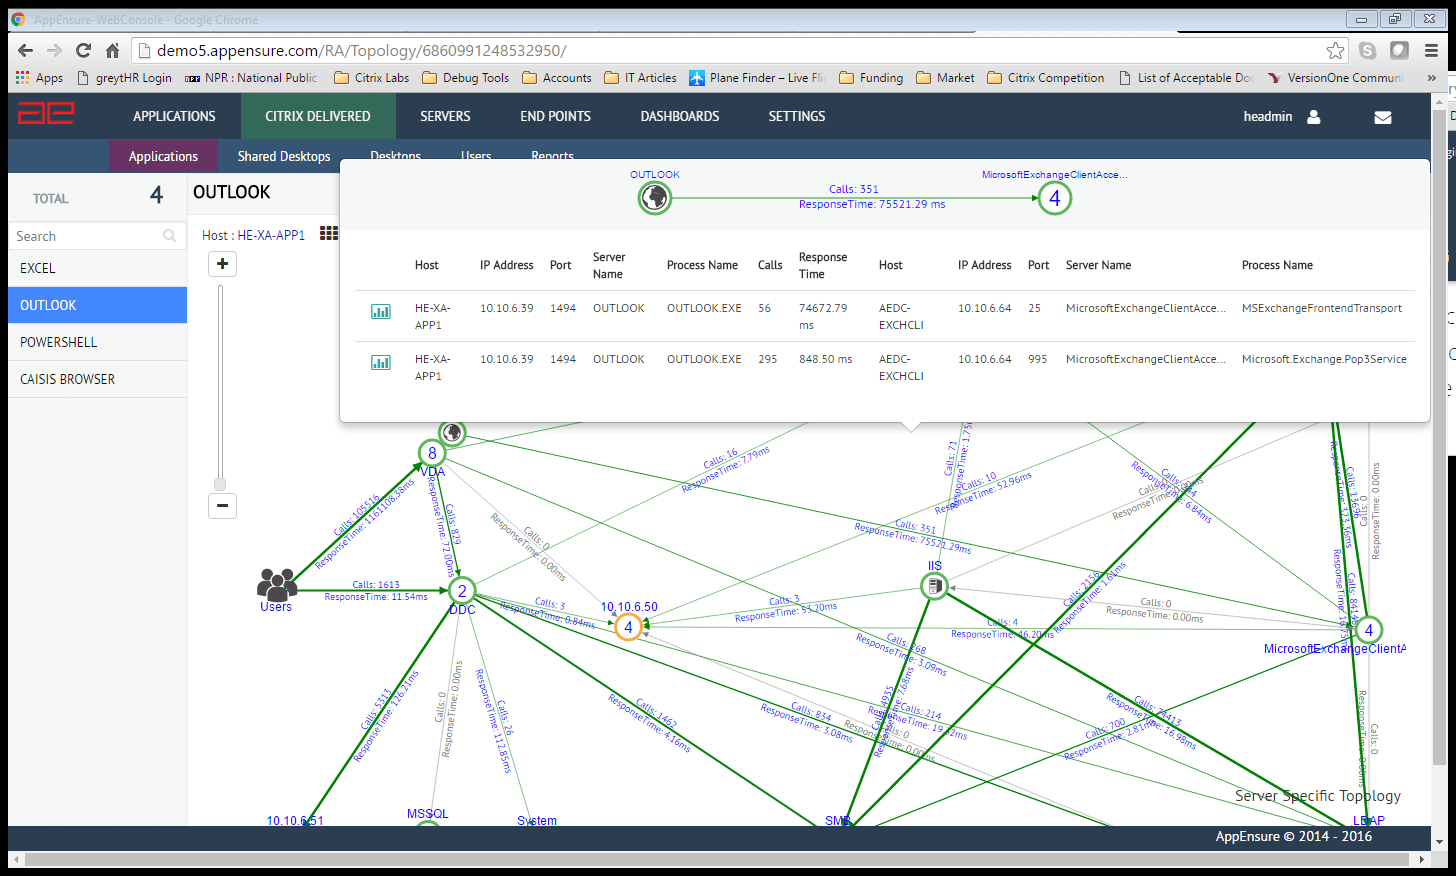
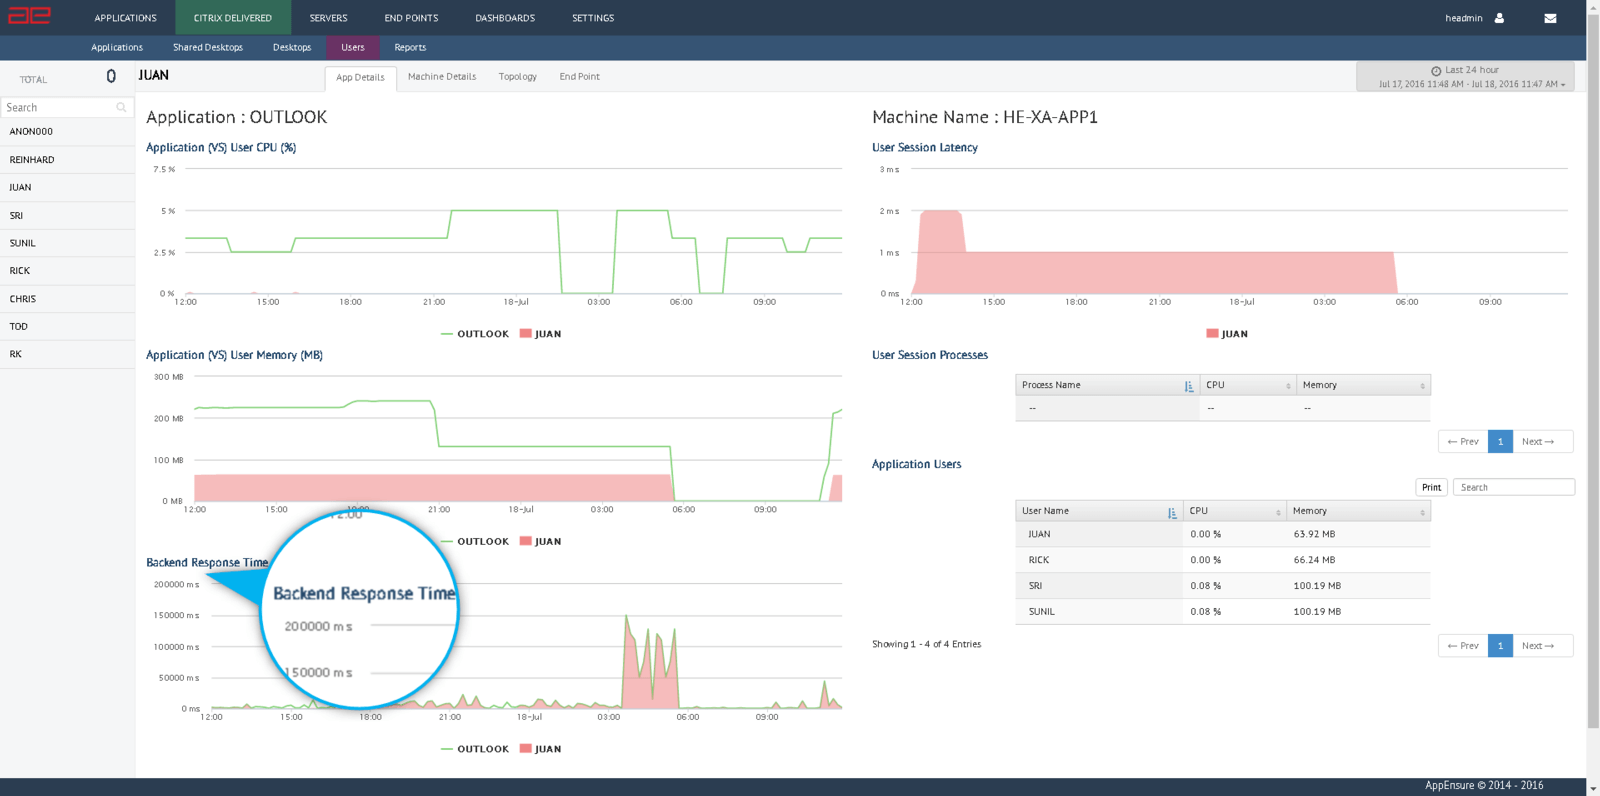
Using an Application Performance Management tool like AppEnsure allows better business decisions by the use of an a well know metric – time.
 IT has access to an amazing amount of data. Often we collect hundreds of data points on one server such as individual processor load, thread state, disk throughput both in and out etc. We then store this in a bin and use this to create a metric called something similar to server performance. When it comes time to provide reports (weekly, monthly and so on) IT then assign some poor person the job of collating this information. This is usually done by running a report and importing it into a spread sheet and then combining various servers and metrics into some grouping and calling it an application. Then some numbers are calculated and saved in the spreadsheet to create a performance over time graph. The same is done with database numbers, application performance, network statistics etc. This process is then repeated by levels of management combining more numbers into a single number to represent a service performance to allow reporting to more senior levels of management.
 Given that IT is all about automating processes this has struck me as somewhat backwards. IT by and large is staffed by realists – the type that don’t respond well to marketing, want solutions and have little time for repetition. A second reality is that IT is a fledgling science. While it has a century under its’ belt it has not developed some niceties like the common taxonomy of biology; every company creates its own rankings and groupings of IT functions. Quite often a great deal of resources are used in creating the custom taxonomy. To add to the frustration of IT managers everywhere different off the shelf applications also present